|
|
DSC Tech Library
 This section of our technical library presents information and documentation relating to Call Center technology and Best Practices plus software and products.
DSC is a leading provider of contact center technology and software solutions as well as predictive dialer phone systems for the modern call center. Customer contact center software includes CRM software and computer telephony integration solutions. These modern products help call center phone agents communicate effectively with your customers and prospects.
This section of our technical library presents information and documentation relating to Call Center technology and Best Practices plus software and products.
DSC is a leading provider of contact center technology and software solutions as well as predictive dialer phone systems for the modern call center. Customer contact center software includes CRM software and computer telephony integration solutions. These modern products help call center phone agents communicate effectively with your customers and prospects.
The following article presents product or service information relating to call centers and customer service help desks.
Call Center Simulation Modeling:
Methods, Challenges, And Opportunities
Page 7
By Vijay Mehrotra, Department of Decision Sciences
College of Business - San Francisco State University
Jason Fama, Engineering Group, Blue Pumpkin Software Inc.
5.2 Numerical Results
5.2.1 Determining the Number of Replications
For each of the individual scenarios that are discussed below,
we ran multiple replications of the simulation model
and computed estimates for performance measures based
on the average of the run length.
For purposes of determining the number of runs for
each scenario, we focused on average weekly Service
Level for the Inbound queue as the statistic of interest. After
each run, we would examine overall standard deviation
of this statistic across all runs to date. We continued to run
additional iterations until this overall standard deviation
was under 2.5%, which we had set arbitrarily as our confidence
threshold.
5.2.2 Base Case
Our baseline scenario is one with no Outbound Cross-
Trained agents. This base case is listed as Scenario 1 in
Table 1 below.
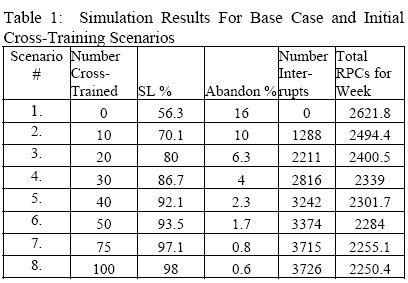
From this base case, it was clear that the Inbound
Agent Group alone cannot deliver the desired Service Level
(80% within 60 seconds), and that the Abandonment
Rate is also much higher than desired.
5.2.3 Varying Cross-Training Levels
We then began to vary the number of Outbound-Skilled
Agents who were included in the Cross-Trained Outbound
group, assuming for these initial experiments that Inbound
calls would immediately overflow to Cross-Trained Outbound
agents whenever all Inbound Only agents were
busy. The impact of this cross training on the population
of Inbound callers is dramatic, as even limited cross training
has a big impact on Service Levels and Abandonment
Rates. In addition, there is an equally obvious negative
impact of this cross training on the Outbound call statistics.
These trade-offs are evident in Table 2 below.
Based on these preliminary simulations, we chose to
focus on cross-training a total of 30-40 Outbound agents.
From here, we turned our attention to defining parameter
for how long Inbound calls should wait before being made
available to Cross-Trained Outbound agents.
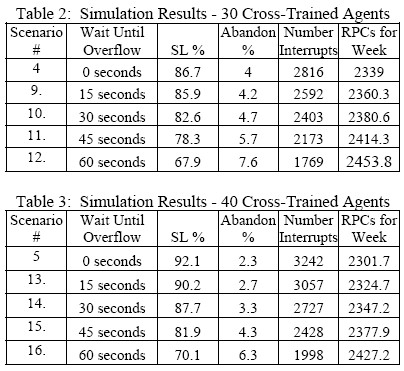
5.2.4 Varying the Wait Time Parameter for
Overflowing Inbound Calls
Results for different scenarios associated with 30 and 40
Cross-Trained Outbound agents are shown in Tables 2
and 3.
5.2.5 Summary
The different scenarios that we have simulated have enabled
us to (a) hone in on the right levels of cross training
to meet the Service Level goals with the current staffing
levels and (b) examine trade-offs between different scenarios
in terms of the key model outputs.
For example, consider Scenarios 3, 10, 14, and 15, all
of which deliver SLs at or above the 80% target. The answer
to which of these is the “best” choice will of course
depend on the relative value of RPCs, Service Levels, and
Abandoned customers. However, it is interesting to note
that Scenario 3 produces essentially the same SL and RPC
values as Scenarios 10 and 15 – but with a substantially
higher abandonment rate. In turn, the tangible difference
between Scenario 14 and 15 enables managers to explicitly
quantify the level of increased Service Level and decreased
abandonment rates against the decreased number of RPCs.
Finally, it is worth mentioning that while we have
shown summary statistics for sixteen scenarios here, it is
relatively easy for us to produce more detailed statistics
and also to vary different parameters to examine any number
of other cases. This flexibility, in turn, enables managers
and analysts to develop a sense for system dynamics
and also to proactively answer common senior management
questions such as “what would a 10% increase in call
volume next week do to us?” or “what is the value of adding
an outsourcer to help us during our peak months?”
Page
[1]
[2]
[3]
[4]
[5]
[6]
7
[8]
Next Page
|

